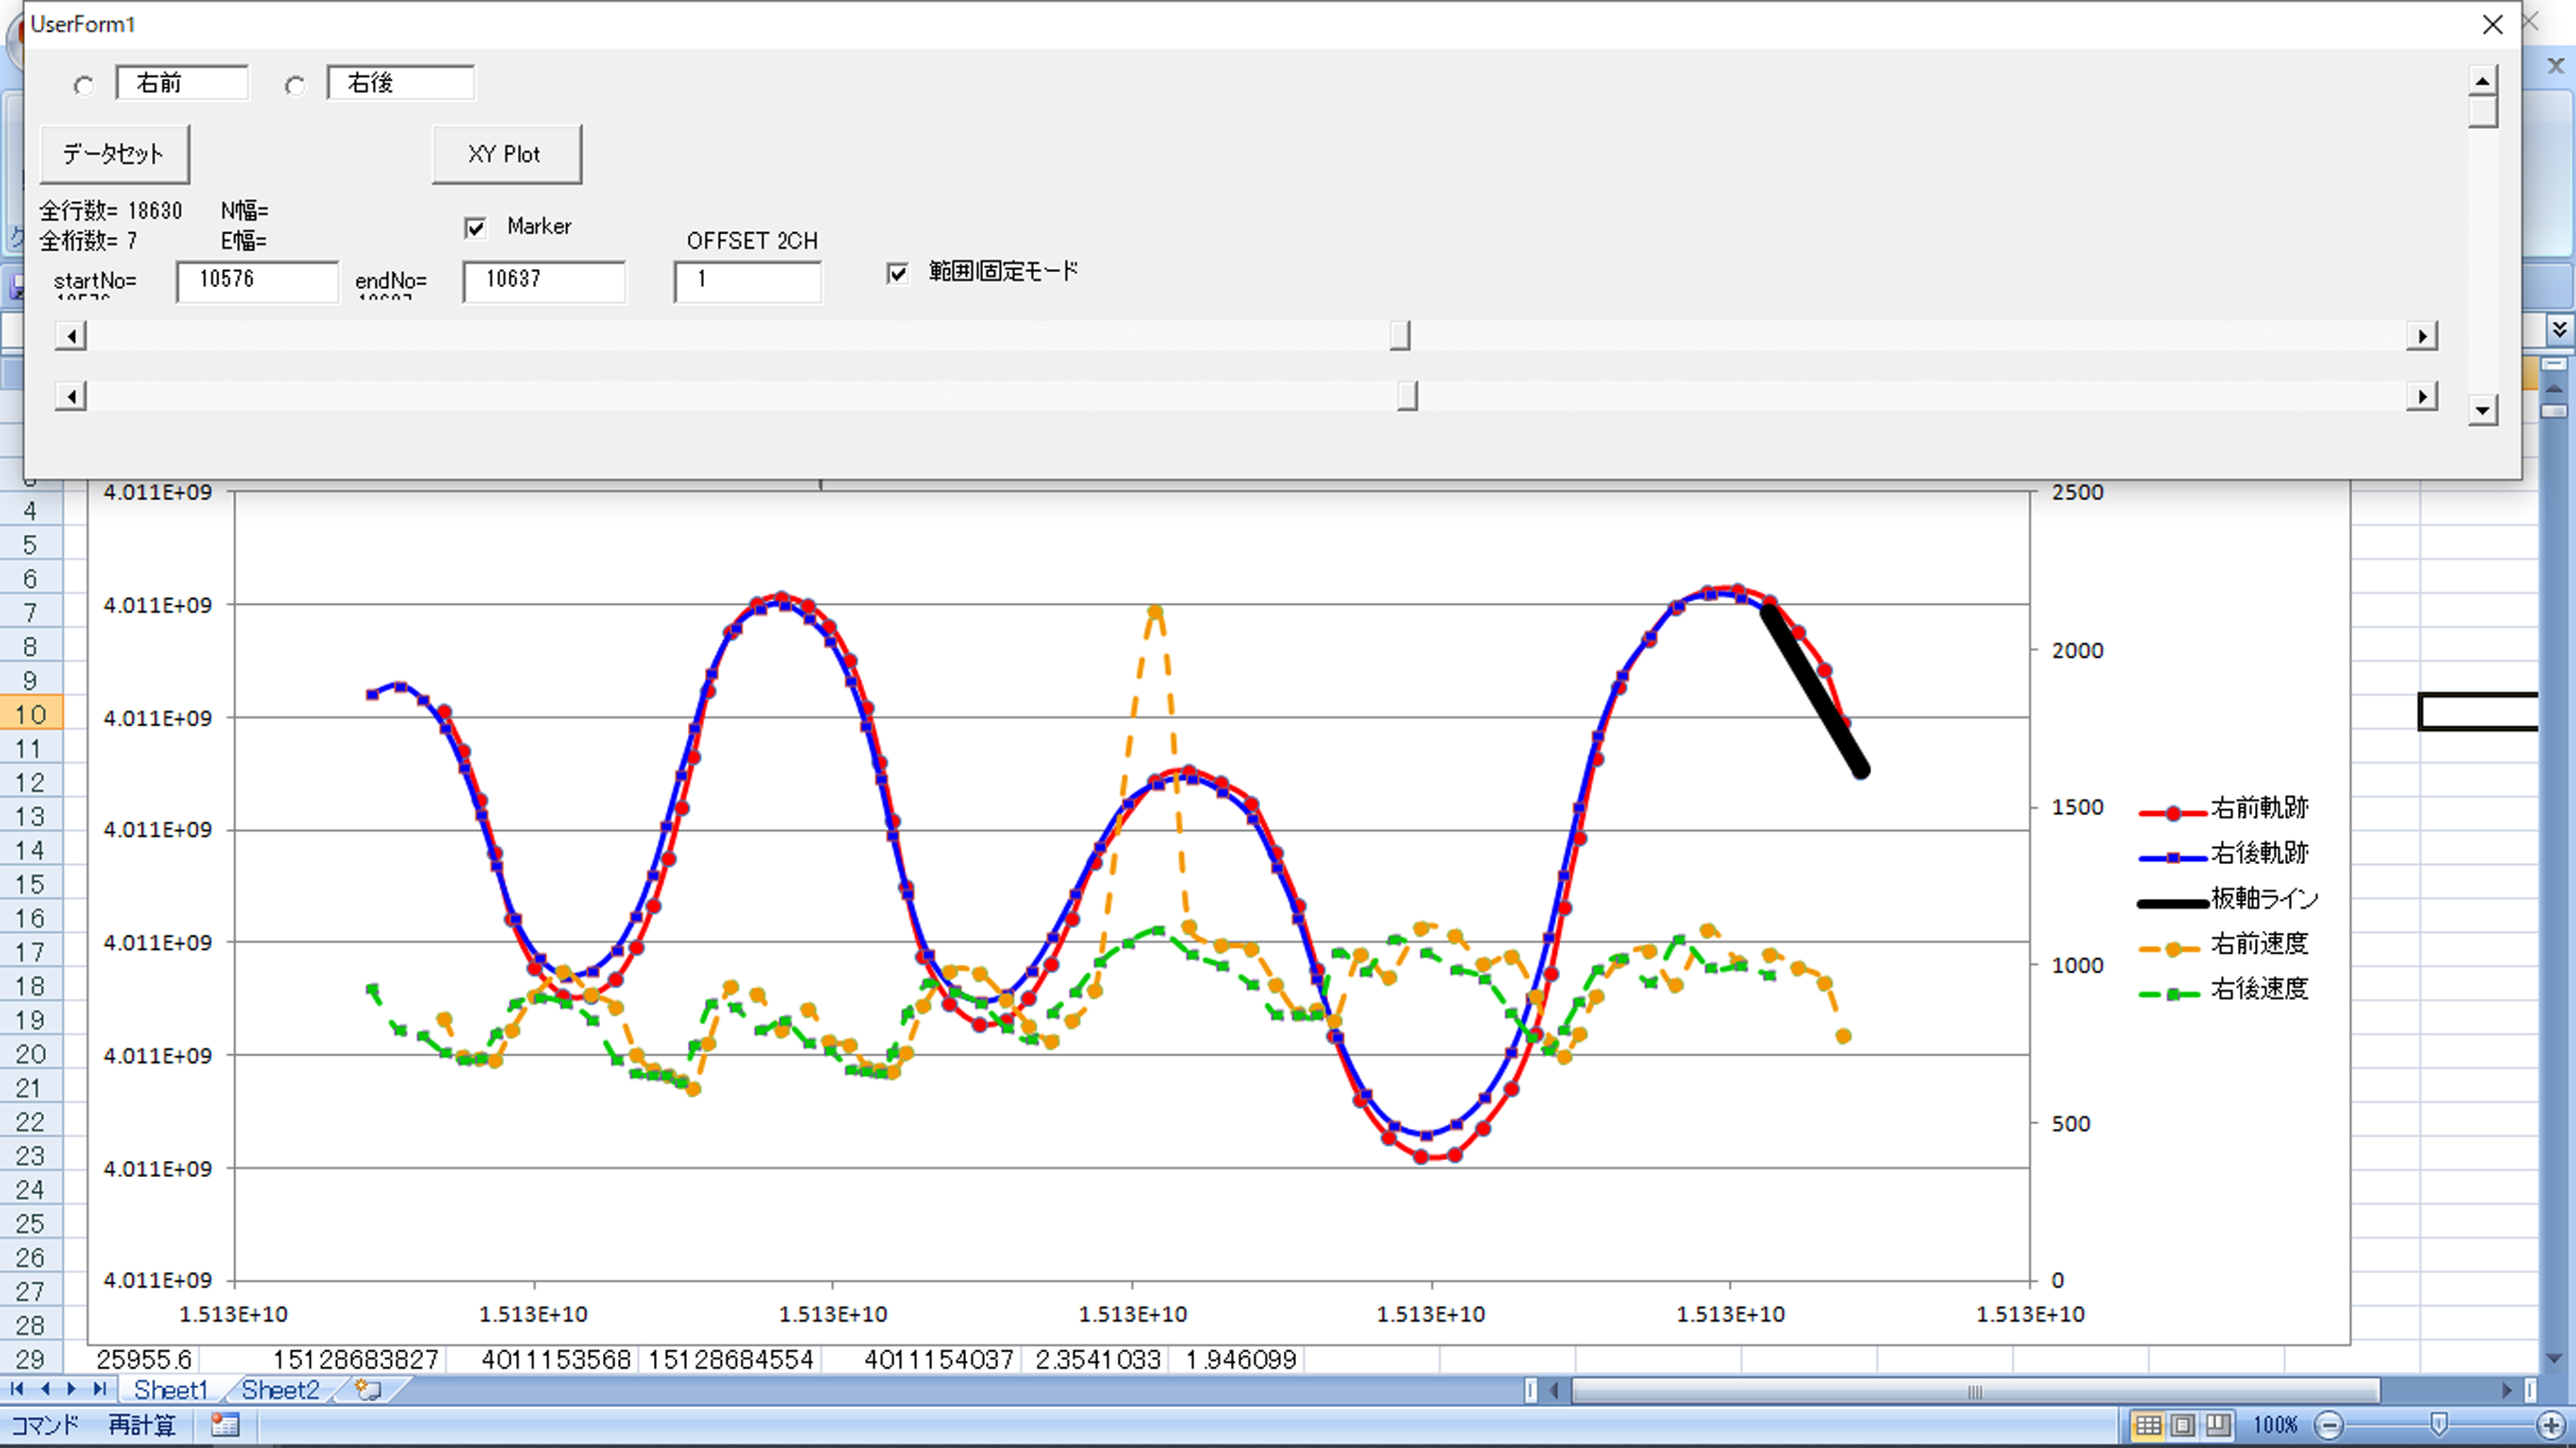
Dim R01x As Range
Dim R01y As Range
Dim R02x As Range
Dim R02y As Range
Dim R03y As Range
Dim R04y As RangeDim R1x As Range
Dim R1y As Range
Dim R2x As Range
Dim R2y As Range
Dim R3y As Range
Dim R4y As Range
Dim Rc0x As Range
Dim Rc0y As Range
Dim Rcx As Range
Dim Rcy As RangeDim Cur1X, Cur1Y, Cur2X, Cur2YDim XtopRow, XtopCol, XMaxRow
Dim YtopRow, YtopCol, YMaxRow
Dim startNo As Integer
Dim endNo As Integer
Dim MaxRow, MaxCol
Dim offset2 As Integer
Dim gflag As Integer
Dim koteihaba
Private Sub CheckBox1_Click()
End Sub
Private Sub UserForm_Activate()
XtopRow = 1
YtopRow = 1
gflag = 0
offset2 = 0
UserForm1.Top = 5
UserForm1.Left = 5
TextBox1.Text = “右前”
TextBox2.Text = “右後”
End Sub
‘=================データ範囲指定=================
Private Sub CommandButton2_Click()
‘XtopRow = Selection.Row
‘XtopCol = Selection.Column
MaxRow = Cells(1, 2).End(xlDown).Row ‘cells(1,2)列の行数を基準
MaxCol = Cells(1, 2).End(xlToRight).Column
Label1.Caption = “全行数=” + Str(MaxRow)
Label2.Caption = “全桁数=” + Str(MaxCol)
Set R01x = Range(Cells(1, 2), Cells(MaxRow, 2))
Set R01y = Range(Cells(1, 3), Cells(MaxRow, 3))
Set R02x = Range(Cells(1, 4), Cells(MaxRow, 4))
Set R02y = Range(Cells(1, 5), Cells(MaxRow, 5))
Set R03y = Range(Cells(1, 6), Cells(MaxRow, 6))
Set R04y = Range(Cells(1, 7), Cells(MaxRow, 7))
‘BaseLine用割りつけX1=(1,11)Y1=(1,12)X2=(2,11)Y2=(2,12)に先端endNoデータを作成
Cells(1, 11) = Cells(1, 2) ‘X1
Cells(1, 12) = Cells(1, 3) ‘Y1
Cells(2, 11) = Cells(1, 4) ‘X2
Cells(2, 12) = Cells(1, 5) ‘Y2
Set Rc0x = Range(Cells(1, 11), Cells(2, 11))
Set Rc0y = Range(Cells(1, 12), Cells(2, 12))
End Sub
‘=================Y軸データ範囲指定================
Private Sub CommandButton3_Click()
YtopRow = Selection.Row
YtopCol = Selection.Column
YMaxRow = Cells(YtopRow, YtopCol).End(xlDown).Row
Label3.Caption = “Ystart=” + Str(YtopRow)
Label4.Caption = “Yend=” + Str(YMaxRow – 1)
End Sub
‘================GRAPH PLOT================================
Private Sub CommandButton1_Click()
offset2 = Val(TextBox5.Text)
‘Set myCht = ActiveSheet.Shapes.AddChart(-1, xlXYScatterLines, 0, 0, 300, 300).Chart
If ActiveSheet.ChartObjects.Count > 0 Then
ActiveSheet.ChartObjects.Delete ‘ グラフがあれば全削除
End If
With ActiveSheet.Shapes.AddChart.Chart
.ChartType = xlXYScatterSmoothNoMarkers
End With
With ActiveSheet.ChartObjects(1)
.Top = 30
.Left = 10
.Height = 350
.Width = 900
End With
If gflag = 0 Then
Set R1x = R01x
Set R1y = R01y
Set R2x = R02x
Set R2y = R02y
Set R3y = R03y
Set R4y = R04y
Set Rcx = Rc0x
Set Rcy = Rc0y
End If
If gflag = 1 Then
If TextBox3.Value <> “” And TextBox4.Value <> “” Then
startNo = Val(TextBox3.Value)
endNo = Val(TextBox4.Value)
End If
Set R1x = Range(Cells(startNo, 2), Cells(endNo, 2))
Set R1y = Range(Cells(startNo, 3), Cells(endNo, 3))
Set R2x = Range(Cells(startNo – offset2, 4), Cells(endNo – offset2, 4))
Set R2y = Range(Cells(startNo – offset2, 5), Cells(endNo – offset2, 5))
Set R3y = Range(Cells(startNo, 6), Cells(endNo – offset2, 6))
Set R4y = Range(Cells(startNo, 7), Cells(endNo – offset2, 7))
‘==Base LIne セル作成して範囲指定=====================================
Cells(1, 11) = Cells(endNo – offset2, 2) ‘X1
Cells(1, 12) = Cells(endNo – offset2, 3) ‘Y1
Cells(2, 11) = Cells(endNo – offset2, 4) ‘X2
Cells(2, 12) = Cells(endNo – offset2, 5) ‘Y2
Set Rcx = Range(Cells(1, 11), Cells(2, 11))
Set Rcy = Range(Cells(1, 12), Cells(2, 12))
End If
With ActiveSheet.ChartObjects(1).Chart.SeriesCollection.NewSeries
.XValues = R1x ‘ Range(Cells(1, 2), Cells(MaxRow, 2))
.Values = R1y ‘ Range(Cells(1, 3), Cells(MaxRow, 3))
.Name = TextBox1.Text + “軌跡”
.Border.Color = RGB(255, 0, 0)
End With
With ActiveSheet.ChartObjects(1).Chart.SeriesCollection.NewSeries
.XValues = R2x
.Values = R2y
.Name = TextBox2.Text + “軌跡”
.Border.Color = RGB(0, 0, 255)
End With
With ActiveSheet.ChartObjects(1).Chart.SeriesCollection.NewSeries
.XValues = R1x
.Values = R3y
.AxisGroup = xlSecondary ‘2軸を設定を指定
.Name = TextBox1.Text + “速度”
.Border.Color = RGB(243, 152, 0)
End With
With ActiveSheet.ChartObjects(1).Chart.SeriesCollection.NewSeries
.XValues = R2x
.Values = R4y
.AxisGroup = xlSecondary ‘2軸を設定を指定
.Name = TextBox2.Text + “速度”
.Border.Color = RGB(0, 200, 0)
End With
‘========================BaseLIneを先端で描く=========================
With ActiveSheet.ChartObjects(1).Chart.SeriesCollection.NewSeries
.XValues = Rcx
.Values = Rcy
‘.AxisGroup = xlSecondary ‘2軸を設定を指定
.Name = “板軸ライン”
.Border.Color = RGB(0, 0, 0)
.Format.Line.Weight = 8
.Border.Color = RGB(0, 200, 0)
.Format.Fill.ForeColor.RGB = RGB(0, 0, 0)
.Format.Fill.BackColor.RGB = RGB(0, 0, 0)
.MarkerStyle = xlMarkerStyleNone
.MarkerSize = 3
End With
End Sub
Private Sub CheckBox1_Change()
If CheckBox1.Value = True Then
With ActiveSheet.ChartObjects(1).Chart
.ChartType = xlXYScatterSmooth
plot
End With
End If
If CheckBox1.Value = False Then
With ActiveSheet.ChartObjects(1).Chart
.ChartType = xlXYScatterSmoothNoMarkers
plot
End With
End If
End Sub
Private Sub CheckBox2_Change()
If CheckBox2.Value = True Then
koteihaba = endNo – startNo
End If
If CheckBox2.Value = False Then
koteihaba = 0
End If
End Sub
‘===================ScrollBar 1 ==============================
Private Sub ScrollBar1_Change()
gflag = 1
offset2 = Val(TextBox5.Text)
ScrollBar1.Max = MaxRow
ScrollBar1.Min = 1
startNo = ScrollBar1.Value
Label5.Caption = “startNo=” + Str(startNo)
TextBox3.Value = startNo
If startNo > endNo – 10 Then
endNo = startNo + 10
End If
If CheckBox2.Value = True Then
endNo = startNo + koteihaba
TextBox4.Value = endNo
ScrollBar2.Value = endNo
End If
plot
End Sub
Private Sub ScrollBar2_Change()
gflag = 1
offset2 = Val(TextBox5.Text)
ScrollBar2.Max = MaxRow
ScrollBar2.Min = 1
endNo = ScrollBar2.Value
Label6.Caption = “endNo=” + Str(endNo)
TextBox4.Value = endNo
If endNo <= startNo Then
endNo = startNo + 10
End If
If CheckBox2.Value = True Then
startNo = endNo – koteihaba
TextBox3.Value = startNo
ScrollBar1.Value = startNo
End If
plot
End Sub
‘================軸の拡大============================================
Private Sub ScrollBar3_Change()
ScrollBar2.Max = MaxRow
ScrollBar2.Min = 1
endNo = ScrollBar2.Value
‘With ActiveSheet.ChartObjects(1).Chart.Axes(xlCategory) ‘Y軸の変更をする場合は、.Axes(xlValue)に変更
‘ .MinimumScale = Cells(startNo, 2)
‘ .MaximumScale = Cells(endNo, 2)
‘ .MajorUnit = 10
‘ .MinorUnit = 10
‘ End With
End Sub
Function plot()
If TextBox3.Value <> “” And TextBox4.Value <> “” Then
startNo = Val(TextBox3.Value)
endNo = Val(TextBox4.Value)
End If
If TextBox3.Value = “” And TextBox4.Value = “” Then
startNo = 1
endNo = MaxRow
End If
Set R1x = Range(Cells(startNo, 2), Cells(endNo, 2))
Set R1y = Range(Cells(startNo, 3), Cells(endNo, 3))
Set R2x = Range(Cells(startNo – offset2, 4), Cells(endNo – offset2, 4))
Set R2y = Range(Cells(startNo – offset2, 5), Cells(endNo – offset2, 5))
Set R3y = Range(Cells(startNo, 6), Cells(endNo – offset2, 6))
Set R4y = Range(Cells(startNo, 7), Cells(endNo, 7))
With ActiveSheet.ChartObjects(1).Chart.SeriesCollection(1) ‘.NewSeries
.XValues = R1x ‘ Range(Cells(1, 2), Cells(MaxRow, 2))
.Values = R1y ‘ Range(Cells(1, 3), Cells(MaxRow, 3))
.Name = TextBox1.Text + “軌跡”
If .ChartType = xlXYScatterSmooth Then
.Format.Fill.ForeColor.RGB = RGB(255, 0, 0)
.Format.Fill.BackColor.RGB = RGB(255, 0, 0)
.MarkerStyle = xlMarkerStyleCircle
.MarkerSize = 6
End If
End With
With ActiveSheet.ChartObjects(1).Chart.SeriesCollection(2) ‘.NewSeries
.XValues = R2x
.Values = R2y
.Name = TextBox2.Text + “軌跡”
If .ChartType = xlXYScatterSmooth Then
.Format.Fill.ForeColor.RGB = RGB(0, 0, 255)
.Format.Fill.BackColor.RGB = RGB(0, 0, 255)
.MarkerStyle = xlMarkerStyleSquare
.MarkerSize = 4
End If
End With
With ActiveSheet.ChartObjects(1).Chart.SeriesCollection(3) ‘.NewSeries
.XValues = R1x
.Values = R3y
.Format.Line.DashStyle = 4
.AxisGroup = xlSecondary ‘2軸を設定を指定
.Name = TextBox1.Text + “速度”
If .ChartType = xlXYScatterSmooth Then
.Format.Fill.ForeColor.RGB = RGB(243, 152, 0)
.Format.Fill.BackColor.RGB = RGB(243, 152, 0)
.MarkerStyle = xlMarkerStyleCircle ‘xlMarkerStyleDiamond
.MarkerSize = 6
End If
End With
With ActiveSheet.ChartObjects(1).Chart.SeriesCollection(4) ‘.NewSeries
.XValues = R2x
.Values = R4y
.Format.Line.DashStyle = 4
.AxisGroup = xlSecondary ‘2軸を設定を指定
.Name = TextBox2.Text + “速度”
If .ChartType = xlXYScatterSmooth Then
.Format.Fill.ForeColor.RGB = RGB(0, 200, 0)
.Format.Fill.BackColor.RGB = RGB(0, 200, 0)
.MarkerStyle = xlMarkerStyleSquare
.MarkerSize = 4
End If
End With
‘========================BaseLIneを先端で描く=========================
‘==Base LIne セル作成して範囲指定=====================================
Cells(1, 11) = Cells(endNo, 2) ‘X1
Cells(1, 12) = Cells(endNo, 3) ‘Y1
Cells(2, 11) = Cells(endNo – offset2, 4) ‘X2 offset有効
Cells(2, 12) = Cells(endNo – offset2, 5) ‘Y2 offset有効
Set Rcx = Range(Cells(1, 11), Cells(2, 11))
Set Rcy = Range(Cells(1, 12), Cells(2, 12))
With ActiveSheet.ChartObjects(1).Chart.SeriesCollection(5)
‘.ChartType = xlXYScatterSmoothNoMarkers
.XValues = Rcx
.Values = Rcy
‘ ‘.AxisGroup = xlSecondary ‘2軸を設定を指定
.Name = “板軸ライン”
.Border.Color = RGB(0, 0, 0)
.Format.Line.Weight = 8
.Format.Fill.ForeColor.RGB = RGB(0, 0, 0)
.Format.Fill.BackColor.RGB = RGB(0, 0, 0)
.MarkerStyle = xlMarkerStyleNone
.MarkerSize = 3
End With
‘ActiveChart.SetSourceData Source:=Range(cells(1,), PlotBy:=xlColumns
End Function |


